สวัสดีครับทุกคน เหมือนเดิมเช่นเคย ก็จะพามาทำระบบ Monitoring application service ของเรา ด้วย Prometheus + Grafana บทความนี้ ก็จะพามา config Spring Reactive WebFlux โปรเจคเดิมของเรา ถ้าใครยังไม่ได้อ่านหรือติดตามผม เดี๋ยวผมทิ้งลายแทงบทความก่อนหน้านี้ไว้ให้ครับ
- Spring WebFlux: พัฒนา Web Application แบบ Reactive ตั้งแต่เริ่มจน Deployment

- Spring Boot Spring Native Image (GraalVM)

- Spring Cloud Config: รวมศูนย์การจัดการ Configuration ด้วย GitHub, Bitbucket และ AWS S3

- Spring Cloud Gateway สำหรับผู้เริ่มต้น

- สร้างระบบ Monitoring Springboot + Prometheus + Grafana ด้วย Docker

- เริ่มสร้าง Gateway Service ด้วย Spring Cloud Gateway และสอนการใช้งาน Mockoon เบื้องต้น

และถ้าเพื่อน ๆ ท่านใดยังไม่มีตัวอย่างโค๊ดของบทความก่อนหน้านี้ สามารถเข้าไป clone github นี้ และไปต่อกันเลย
แก้ไขโค๊ดเปิดการใช้งาน monitoring ของโปรเจค
– pom.xml เพิ่ม micrometer-registry-prometheus ใน pom.xml
<dependency>
   <groupId>io.micrometer</groupId>
   <artifactId>micrometer-registry-prometheus</artifactId>
   <scope>runtime</scope>
</dependency>
– src/main/java/com/poolsawat/reactivewebflux/configs/WebClientConfiguration.java เพิ่มโค๊ด .metrics(true, s -> s) เพื่อ enabled metrics ให้กับ http client connection
return HttpClient.create(connectionProvider)
                .metrics(true, s -> s)
                .option(ChannelOption.CONNECT_TIMEOUT_MILLIS, 15000) // 30 sec
                .doOnConnected( it -> {
                    it.addHandlerLast(new ReadTimeoutHandler(30000)) // 30 sec
                            .addHandlerLast(new WriteTimeoutHandler(30000)); // 30 sec
                })
                .doOnRequest( (x,conn) -> conn.addHandlerFirst(clientLogger))
                .doOnResponse( (x, conn) -> conn.addHandlerFirst(clientLogger));
– src/main/resources/application.properties เพิ่ม config exposure.include
management.server.port=18443
management.endpoints.web.exposure.include=*
– ทำการ start application server ด้วยคำสั่ง `mvn spring-boot:run`
curl --silent --location 'http://localhost:8443/reactive/welcome'– ตรวจสอบ metrics ต่าง ๆ ที่พร้อมจะให้ prometheus ดูดไปเก็บ
curl --silent --location 'http://localhost:18443/actuator/prometheus'# HELP reactor_netty_bytebuf_allocator_normal_cache_size
# TYPE reactor_netty_bytebuf_allocator_normal_cache_size gauge
reactor_netty_bytebuf_allocator_normal_cache_size{id="777789558",type="pooled",} 64.0
# HELP jvm_classes_unloaded_classes_total The total number of classes unloaded since the Java virtual machine has started execution
# TYPE jvm_classes_unloaded_classes_total counter
jvm_classes_unloaded_classes_total 0.0
# HELP jvm_gc_overhead_percent An approximation of the percent of CPU time used by GC activities over the last lookback period or since monitoring began, whichever is shorter, in the range [0..1]
# TYPE jvm_gc_overhead_percent gauge
jvm_gc_overhead_percent 2.0E-5
# HELP jvm_compilation_time_ms_total The approximate accumulated elapsed time spent in compilation
# TYPE jvm_compilation_time_ms_total counter
jvm_compilation_time_ms_total{compiler="HotSpot 64-Bit Tiered Compilers",} 2128.0
# HELP process_cpu_usage The "recent cpu usage" for the Java Virtual Machine process
# TYPE process_cpu_usage gauge
process_cpu_usage 8.944394124364983E-4
# HELP reactor_netty_bytebuf_allocator_active_heap_memory
# TYPE reactor_netty_bytebuf_allocator_active_heap_memory gauge
reactor_netty_bytebuf_allocator_active_heap_memory{id="777789558",type="pooled",} 0.0
# HELP system_cpu_count The number of processors available to the Java virtual machine
# TYPE system_cpu_count gauge
system_cpu_count 8.0
# HELP reactor_netty_bytebuf_allocator_heap_arenas
# TYPE reactor_netty_bytebuf_allocator_heap_arenas gauge
reactor_netty_bytebuf_allocator_heap_arenas{id="777789558",type="pooled",} 16.0
# HELP executor_queue_remaining_tasks The number of additional elements that this queue can ideally accept without blocking
# TYPE executor_queue_remaining_tasks gauge
executor_queue_remaining_tasks{name="applicationTaskExecutor",} 2.147483647E9
# HELP reactor_netty_http_client_data_received_time_seconds_max
# TYPE reactor_netty_http_client_data_received_time_seconds_max gauge
reactor_netty_http_client_data_received_time_seconds_max{method="GET",remote_address="localhost:4000",status="200",uri="/reactive/items",} 0.003846828
# HELP reactor_netty_http_client_data_received_time_seconds
# TYPE reactor_netty_http_client_data_received_time_seconds summary
reactor_netty_http_client_data_received_time_seconds_count{method="GET",remote_address="localhost:4000",status="200",uri="/reactive/items",} 2.0
reactor_netty_http_client_data_received_time_seconds_sum{method="GET",remote_address="localhost:4000",status="200",uri="/reactive/items",} 0.021145002
# HELP executor_queued_tasks The approximate number of tasks that are queued for execution
# TYPE executor_queued_tasks gauge
executor_queued_tasks{name="applicationTaskExecutor",} 0.0
# HELP reactor_netty_bytebuf_allocator_chunk_size
# TYPE reactor_netty_bytebuf_allocator_chunk_size gauge
reactor_netty_bytebuf_allocator_chunk_size{id="777789558",type="pooled",} 4194304.0
# HELP jvm_threads_live_threads The current number of live threads including both daemon and non-daemon threads
# TYPE jvm_threads_live_threads gauge
jvm_threads_live_threads 24.0
# HELP reactor_netty_eventloop_pending_tasks
# TYPE reactor_netty_eventloop_pending_tasks gauge
reactor_netty_eventloop_pending_tasks{name="reactor-http-nio-1",} 0.0
reactor_netty_eventloop_pending_tasks{name="reactor-http-nio-5",} 0.0
# HELP jvm_gc_memory_promoted_bytes_total Count of positive increases in the size of the old generation memory pool before GC to after GC
# TYPE jvm_gc_memory_promoted_bytes_total counter
jvm_gc_memory_promoted_bytes_total 4407808.0
# HELP jvm_memory_committed_bytes The amount of memory in bytes that is committed for the Java virtual machine to use
# TYPE jvm_memory_committed_bytes gauge
jvm_memory_committed_bytes{area="heap",id="G1 Survivor Space",} 2097152.0
jvm_memory_committed_bytes{area="heap",id="G1 Old Gen",} 3.3554432E7
jvm_memory_committed_bytes{area="nonheap",id="Metaspace",} 4.0370176E7
jvm_memory_committed_bytes{area="nonheap",id="CodeCache",} 1.4024704E7
jvm_memory_committed_bytes{area="heap",id="G1 Eden Space",} 5.6623104E7
jvm_memory_committed_bytes{area="nonheap",id="Compressed Class Space",} 6094848.0
# HELP http_server_requests_active_seconds_max
# TYPE http_server_requests_active_seconds_max gauge
http_server_requests_active_seconds_max{exception="none",method="GET",outcome="SUCCESS",status="200",uri="UNKNOWN",} 6.84796E-4
# HELP http_server_requests_active_seconds
# TYPE http_server_requests_active_seconds summary
http_server_requests_active_seconds_active_count{exception="none",method="GET",outcome="SUCCESS",status="200",uri="UNKNOWN",} 1.0
http_server_requests_active_seconds_duration_sum{exception="none",method="GET",outcome="SUCCESS",status="200",uri="UNKNOWN",} 6.83326E-4
# HELP executor_pool_max_threads The maximum allowed number of threads in the pool
# TYPE executor_pool_max_threads gauge
executor_pool_max_threads{name="applicationTaskExecutor",} 2.147483647E9
# HELP reactor_netty_connection_provider_idle_connections
# TYPE reactor_netty_connection_provider_idle_connections gauge
reactor_netty_connection_provider_idle_connections{id="-75055066",name="reactive-tcp-connection-pool",remote_address="localhost:4000",} 1.0
# HELP jvm_memory_max_bytes The maximum amount of memory in bytes that can be used for memory management
# TYPE jvm_memory_max_bytes gauge
jvm_memory_max_bytes{area="heap",id="G1 Survivor Space",} -1.0
jvm_memory_max_bytes{area="heap",id="G1 Old Gen",} 4.294967296E9
jvm_memory_max_bytes{area="nonheap",id="Metaspace",} -1.0
jvm_memory_max_bytes{area="nonheap",id="CodeCache",} 5.0331648E7
jvm_memory_max_bytes{area="heap",id="G1 Eden Space",} -1.0
jvm_memory_max_bytes{area="nonheap",id="Compressed Class Space",} 1.073741824E9
# HELP jvm_threads_daemon_threads The current number of live daemon threads
# TYPE jvm_threads_daemon_threads gauge
jvm_threads_daemon_threads 21.0
# HELP jvm_buffer_total_capacity_bytes An estimate of the total capacity of the buffers in this pool
# TYPE jvm_buffer_total_capacity_bytes gauge
jvm_buffer_total_capacity_bytes{id="mapped - 'non-volatile memory'",} 0.0
jvm_buffer_total_capacity_bytes{id="mapped",} 0.0
jvm_buffer_total_capacity_bytes{id="direct",} 2.9368327E7
# HELP executor_pool_core_threads The core number of threads for the pool
# TYPE executor_pool_core_threads gauge
executor_pool_core_threads{name="applicationTaskExecutor",} 8.0
# HELP reactor_netty_bytebuf_allocator_used_heap_memory
# TYPE reactor_netty_bytebuf_allocator_used_heap_memory gauge
reactor_netty_bytebuf_allocator_used_heap_memory{id="777789558",type="pooled",} 0.0
# HELP jvm_gc_memory_allocated_bytes_total Incremented for an increase in the size of the (young) heap memory pool after one GC to before the next
# TYPE jvm_gc_memory_allocated_bytes_total counter
jvm_gc_memory_allocated_bytes_total 4.90733568E8
# HELP reactor_netty_http_client_data_sent_time_seconds_max
# TYPE reactor_netty_http_client_data_sent_time_seconds_max gauge
reactor_netty_http_client_data_sent_time_seconds_max{method="GET",remote_address="localhost:4000",uri="/reactive/items",} 7.86414E-4
# HELP reactor_netty_http_client_data_sent_time_seconds
# TYPE reactor_netty_http_client_data_sent_time_seconds summary
reactor_netty_http_client_data_sent_time_seconds_count{method="GET",remote_address="localhost:4000",uri="/reactive/items",} 2.0
reactor_netty_http_client_data_sent_time_seconds_sum{method="GET",remote_address="localhost:4000",uri="/reactive/items",} 0.010270064
# HELP jvm_gc_live_data_size_bytes Size of long-lived heap memory pool after reclamation
# TYPE jvm_gc_live_data_size_bytes gauge
jvm_gc_live_data_size_bytes 0.0
# HELP jvm_gc_pause_seconds Time spent in GC pause
# TYPE jvm_gc_pause_seconds summary
jvm_gc_pause_seconds_count{action="end of minor GC",cause="Metadata GC Threshold",gc="G1 Young Generation",} 1.0
jvm_gc_pause_seconds_sum{action="end of minor GC",cause="Metadata GC Threshold",gc="G1 Young Generation",} 0.009
jvm_gc_pause_seconds_count{action="end of minor GC",cause="G1 Evacuation Pause",gc="G1 Young Generation",} 10.0
jvm_gc_pause_seconds_sum{action="end of minor GC",cause="G1 Evacuation Pause",gc="G1 Young Generation",} 0.041
# HELP jvm_gc_pause_seconds_max Time spent in GC pause
# TYPE jvm_gc_pause_seconds_max gauge
jvm_gc_pause_seconds_max{action="end of minor GC",cause="Metadata GC Threshold",gc="G1 Young Generation",} 0.0
jvm_gc_pause_seconds_max{action="end of minor GC",cause="G1 Evacuation Pause",gc="G1 Young Generation",} 0.006
# HELP reactor_netty_connection_provider_total_connections
# TYPE reactor_netty_connection_provider_total_connections gauge
reactor_netty_connection_provider_total_connections{id="-75055066",name="reactive-tcp-connection-pool",remote_address="localhost:4000",} 1.0
# HELP system_load_average_1m The sum of the number of runnable entities queued to available processors and the number of runnable entities running on the available processors averaged over a period of time
# TYPE system_load_average_1m gauge
system_load_average_1m 5.75927734375
# HELP process_files_open_files The open file descriptor count
# TYPE process_files_open_files gauge
process_files_open_files 115.0
# HELP reactor_netty_bytebuf_allocator_active_direct_memory
# TYPE reactor_netty_bytebuf_allocator_active_direct_memory gauge
reactor_netty_bytebuf_allocator_active_direct_memory{id="777789558",type="pooled",} 2048.0
# HELP reactor_netty_connection_provider_active_connections
# TYPE reactor_netty_connection_provider_active_connections gauge
reactor_netty_connection_provider_active_connections{id="-75055066",name="reactive-tcp-connection-pool",remote_address="localhost:4000",} 0.0
# HELP reactor_netty_bytebuf_allocator_direct_arenas
# TYPE reactor_netty_bytebuf_allocator_direct_arenas gauge
reactor_netty_bytebuf_allocator_direct_arenas{id="777789558",type="pooled",} 16.0
# HELP logback_events_total Number of log events that were enabled by the effective log level
# TYPE logback_events_total counter
logback_events_total{level="warn",} 0.0
logback_events_total{level="debug",} 0.0
logback_events_total{level="error",} 0.0
logback_events_total{level="trace",} 0.0
logback_events_total{level="info",} 10.0
# HELP jvm_threads_peak_threads The peak live thread count since the Java virtual machine started or peak was reset
# TYPE jvm_threads_peak_threads gauge
jvm_threads_peak_threads 27.0
# HELP disk_total_bytes Total space for path
# TYPE disk_total_bytes gauge
disk_total_bytes{path="/Users/poolsawat.api/Documents/poolsawat.com/java/com.poolsawat.reactive-webflux/.",} 2.50685575168E11
# HELP http_server_requests_seconds
# TYPE http_server_requests_seconds summary
http_server_requests_seconds_count{error="none",exception="none",method="GET",outcome="SUCCESS",status="200",uri="/actuator/prometheus",} 1619.0
http_server_requests_seconds_sum{error="none",exception="none",method="GET",outcome="SUCCESS",status="200",uri="/actuator/prometheus",} 4.741476756
http_server_requests_seconds_count{error="none",exception="none",method="GET",outcome="SUCCESS",status="200",uri="/welcome",} 2.0
http_server_requests_seconds_sum{error="none",exception="none",method="GET",outcome="SUCCESS",status="200",uri="/welcome",} 0.550828592
# HELP http_server_requests_seconds_max
# TYPE http_server_requests_seconds_max gauge
http_server_requests_seconds_max{error="none",exception="none",method="GET",outcome="SUCCESS",status="200",uri="/actuator/prometheus",} 0.009232148
http_server_requests_seconds_max{error="none",exception="none",method="GET",outcome="SUCCESS",status="200",uri="/welcome",} 0.060503072
# HELP reactor_netty_http_client_connect_time_seconds
# TYPE reactor_netty_http_client_connect_time_seconds summary
reactor_netty_http_client_connect_time_seconds_count{remote_address="localhost:4000",status="SUCCESS",} 2.0
reactor_netty_http_client_connect_time_seconds_sum{remote_address="localhost:4000",status="SUCCESS",} 0.005765109
# HELP reactor_netty_http_client_connect_time_seconds_max
# TYPE reactor_netty_http_client_connect_time_seconds_max gauge
reactor_netty_http_client_connect_time_seconds_max{remote_address="localhost:4000",status="SUCCESS",} 6.56119E-4
# HELP jvm_gc_max_data_size_bytes Max size of long-lived heap memory pool
# TYPE jvm_gc_max_data_size_bytes gauge
jvm_gc_max_data_size_bytes 4.294967296E9
# HELP jvm_buffer_memory_used_bytes An estimate of the memory that the Java virtual machine is using for this buffer pool
# TYPE jvm_buffer_memory_used_bytes gauge
jvm_buffer_memory_used_bytes{id="mapped - 'non-volatile memory'",} 0.0
jvm_buffer_memory_used_bytes{id="mapped",} 0.0
jvm_buffer_memory_used_bytes{id="direct",} 2.9368328E7
# HELP reactor_netty_connection_provider_pending_connections
# TYPE reactor_netty_connection_provider_pending_connections gauge
reactor_netty_connection_provider_pending_connections{id="-75055066",name="reactive-tcp-connection-pool",remote_address="localhost:4000",} 0.0
# HELP reactor_netty_bytebuf_allocator_used_direct_memory
# TYPE reactor_netty_bytebuf_allocator_used_direct_memory gauge
reactor_netty_bytebuf_allocator_used_direct_memory{id="777789558",type="pooled",} 2.9360128E7
# HELP reactor_netty_bytebuf_allocator_small_cache_size
# TYPE reactor_netty_bytebuf_allocator_small_cache_size gauge
reactor_netty_bytebuf_allocator_small_cache_size{id="777789558",type="pooled",} 256.0
# HELP executor_pool_size_threads The current number of threads in the pool
# TYPE executor_pool_size_threads gauge
executor_pool_size_threads{name="applicationTaskExecutor",} 0.0
# HELP application_started_time_seconds Time taken (ms) to start the application
# TYPE application_started_time_seconds gauge
application_started_time_seconds{main_application_class="com.poolsawat.reactivewebflux.ReactiveApplication",} 2.144
# HELP jvm_memory_usage_after_gc_percent The percentage of long-lived heap pool used after the last GC event, in the range [0..1]
# TYPE jvm_memory_usage_after_gc_percent gauge
jvm_memory_usage_after_gc_percent{area="heap",pool="long-lived",} 0.004728555679321289
# HELP reactor_netty_connection_provider_max_pending_connections
# TYPE reactor_netty_connection_provider_max_pending_connections gauge
reactor_netty_connection_provider_max_pending_connections{id="-75055066",name="reactive-tcp-connection-pool",remote_address="localhost:4000",} 20.0
# HELP reactor_netty_http_client_data_received_bytes_max
# TYPE reactor_netty_http_client_data_received_bytes_max gauge
reactor_netty_http_client_data_received_bytes_max{remote_address="localhost:4000",uri="/reactive/items",} 113.0
reactor_netty_http_client_data_received_bytes_max{remote_address="localhost:4000",uri="http",} 284.0
# HELP reactor_netty_http_client_data_received_bytes
# TYPE reactor_netty_http_client_data_received_bytes summary
reactor_netty_http_client_data_received_bytes_count{remote_address="localhost:4000",uri="/reactive/items",} 2.0
reactor_netty_http_client_data_received_bytes_sum{remote_address="localhost:4000",uri="/reactive/items",} 226.0
reactor_netty_http_client_data_received_bytes_count{remote_address="localhost:4000",uri="http",} 2.0
reactor_netty_http_client_data_received_bytes_sum{remote_address="localhost:4000",uri="http",} 568.0
# HELP jvm_threads_started_threads_total The total number of application threads started in the JVM
# TYPE jvm_threads_started_threads_total counter
jvm_threads_started_threads_total 46.0
# HELP process_files_max_files The maximum file descriptor count
# TYPE process_files_max_files gauge
process_files_max_files 10240.0
# HELP process_start_time_seconds Start time of the process since unix epoch.
# TYPE process_start_time_seconds gauge
process_start_time_seconds 1.693064562345E9
# HELP jvm_classes_loaded_classes The number of classes that are currently loaded in the Java virtual machine
# TYPE jvm_classes_loaded_classes gauge
jvm_classes_loaded_classes 9548.0
# HELP application_ready_time_seconds Time taken (ms) for the application to be ready to service requests
# TYPE application_ready_time_seconds gauge
application_ready_time_seconds{main_application_class="com.poolsawat.reactivewebflux.ReactiveApplication",} 2.148
# HELP process_uptime_seconds The uptime of the Java virtual machine
# TYPE process_uptime_seconds gauge
process_uptime_seconds 3228.09
# HELP executor_completed_tasks_total The approximate total number of tasks that have completed execution
# TYPE executor_completed_tasks_total counter
executor_completed_tasks_total{name="applicationTaskExecutor",} 0.0
# HELP reactor_netty_http_client_data_sent_bytes_max
# TYPE reactor_netty_http_client_data_sent_bytes_max gauge
reactor_netty_http_client_data_sent_bytes_max{remote_address="localhost:4000",uri="/reactive/items",} 0.0
reactor_netty_http_client_data_sent_bytes_max{remote_address="localhost:4000",uri="http",} 144.0
# HELP reactor_netty_http_client_data_sent_bytes
# TYPE reactor_netty_http_client_data_sent_bytes summary
reactor_netty_http_client_data_sent_bytes_count{remote_address="localhost:4000",uri="/reactive/items",} 2.0
reactor_netty_http_client_data_sent_bytes_sum{remote_address="localhost:4000",uri="/reactive/items",} 0.0
reactor_netty_http_client_data_sent_bytes_count{remote_address="localhost:4000",uri="http",} 2.0
reactor_netty_http_client_data_sent_bytes_sum{remote_address="localhost:4000",uri="http",} 288.0
# HELP jvm_buffer_count_buffers An estimate of the number of buffers in the pool
# TYPE jvm_buffer_count_buffers gauge
jvm_buffer_count_buffers{id="mapped - 'non-volatile memory'",} 0.0
jvm_buffer_count_buffers{id="mapped",} 0.0
jvm_buffer_count_buffers{id="direct",} 11.0
# HELP jvm_info JVM version info
# TYPE jvm_info gauge
jvm_info{runtime="Java(TM) SE Runtime Environment",vendor="Oracle Corporation",version="17.0.2+8-LTS-86",} 1.0
# HELP jvm_memory_used_bytes The amount of used memory
# TYPE jvm_memory_used_bytes gauge
jvm_memory_used_bytes{area="heap",id="G1 Survivor Space",} 1547896.0
jvm_memory_used_bytes{area="heap",id="G1 Old Gen",} 2.0308992E7
jvm_memory_used_bytes{area="nonheap",id="Metaspace",} 3.9839872E7
jvm_memory_used_bytes{area="nonheap",id="CodeCache",} 1.2789376E7
jvm_memory_used_bytes{area="heap",id="G1 Eden Space",} 8388608.0
jvm_memory_used_bytes{area="nonheap",id="Compressed Class Space",} 5844280.0
# HELP reactor_netty_http_client_address_resolver_seconds_max
# TYPE reactor_netty_http_client_address_resolver_seconds_max gauge
reactor_netty_http_client_address_resolver_seconds_max{remote_address="localhost:4000",status="SUCCESS",} 2.371E-4
# HELP reactor_netty_http_client_address_resolver_seconds
# TYPE reactor_netty_http_client_address_resolver_seconds summary
reactor_netty_http_client_address_resolver_seconds_count{remote_address="localhost:4000",status="SUCCESS",} 2.0
reactor_netty_http_client_address_resolver_seconds_sum{remote_address="localhost:4000",status="SUCCESS",} 0.009114398
# HELP reactor_netty_http_client_response_time_seconds
# TYPE reactor_netty_http_client_response_time_seconds summary
reactor_netty_http_client_response_time_seconds_count{method="GET",remote_address="localhost:4000",status="200",uri="/reactive/items",} 2.0
reactor_netty_http_client_response_time_seconds_sum{method="GET",remote_address="localhost:4000",status="200",uri="/reactive/items",} 0.054952767
# HELP reactor_netty_http_client_response_time_seconds_max
# TYPE reactor_netty_http_client_response_time_seconds_max gauge
reactor_netty_http_client_response_time_seconds_max{method="GET",remote_address="localhost:4000",status="200",uri="/reactive/items",} 0.019430612
# HELP executor_active_threads The approximate number of threads that are actively executing tasks
# TYPE executor_active_threads gauge
executor_active_threads{name="applicationTaskExecutor",} 0.0
# HELP jvm_threads_states_threads The current number of threads
# TYPE jvm_threads_states_threads gauge
jvm_threads_states_threads{state="runnable",} 17.0
jvm_threads_states_threads{state="blocked",} 0.0
jvm_threads_states_threads{state="waiting",} 4.0
jvm_threads_states_threads{state="timed-waiting",} 3.0
jvm_threads_states_threads{state="new",} 0.0
jvm_threads_states_threads{state="terminated",} 0.0
# HELP reactor_netty_connection_provider_max_connections
# TYPE reactor_netty_connection_provider_max_connections gauge
reactor_netty_connection_provider_max_connections{id="-75055066",name="reactive-tcp-connection-pool",remote_address="localhost:4000",} 10.0
# HELP system_cpu_usage The "recent cpu usage" of the system the application is running in
# TYPE system_cpu_usage gauge
system_cpu_usage 0.27743526510480887
# HELP disk_free_bytes Usable space for path
# TYPE disk_free_bytes gauge
disk_free_bytes{path="/Users/poolsawat.api/Documents/poolsawat.com/java/com.poolsawat.reactive-webflux/.",} 4.5876965376E10
# HELP reactor_netty_bytebuf_allocator_threadlocal_caches
# TYPE reactor_netty_bytebuf_allocator_threadlocal_caches gauge
reactor_netty_bytebuf_allocator_threadlocal_caches{id="777789558",type="pooled",} 7.0เริ่ม start Prometheus และ Grafana server ด้วย Docker compose
ให้ไป clone github Docker-Compose-Prometheus-and-Grafana นี้ แก้ไข prometheus scrape config
– prometheus.yml
scrape_configs
  ...
  - job_name: 'Spring Boot Reactive WebFlux Application'
    metrics_path: '/actuator/prometheus'
    scrape_interval: 2s
    static_configs:
      - targets: ['host.docker.internal:18443']
        labels:
          application: 'Spring Boot Reactive WebFlux Application'
– start docker compose: docker-compose up -d
- ทดสอบเข้า Prometheus Graph Query: http://localhost:9090/
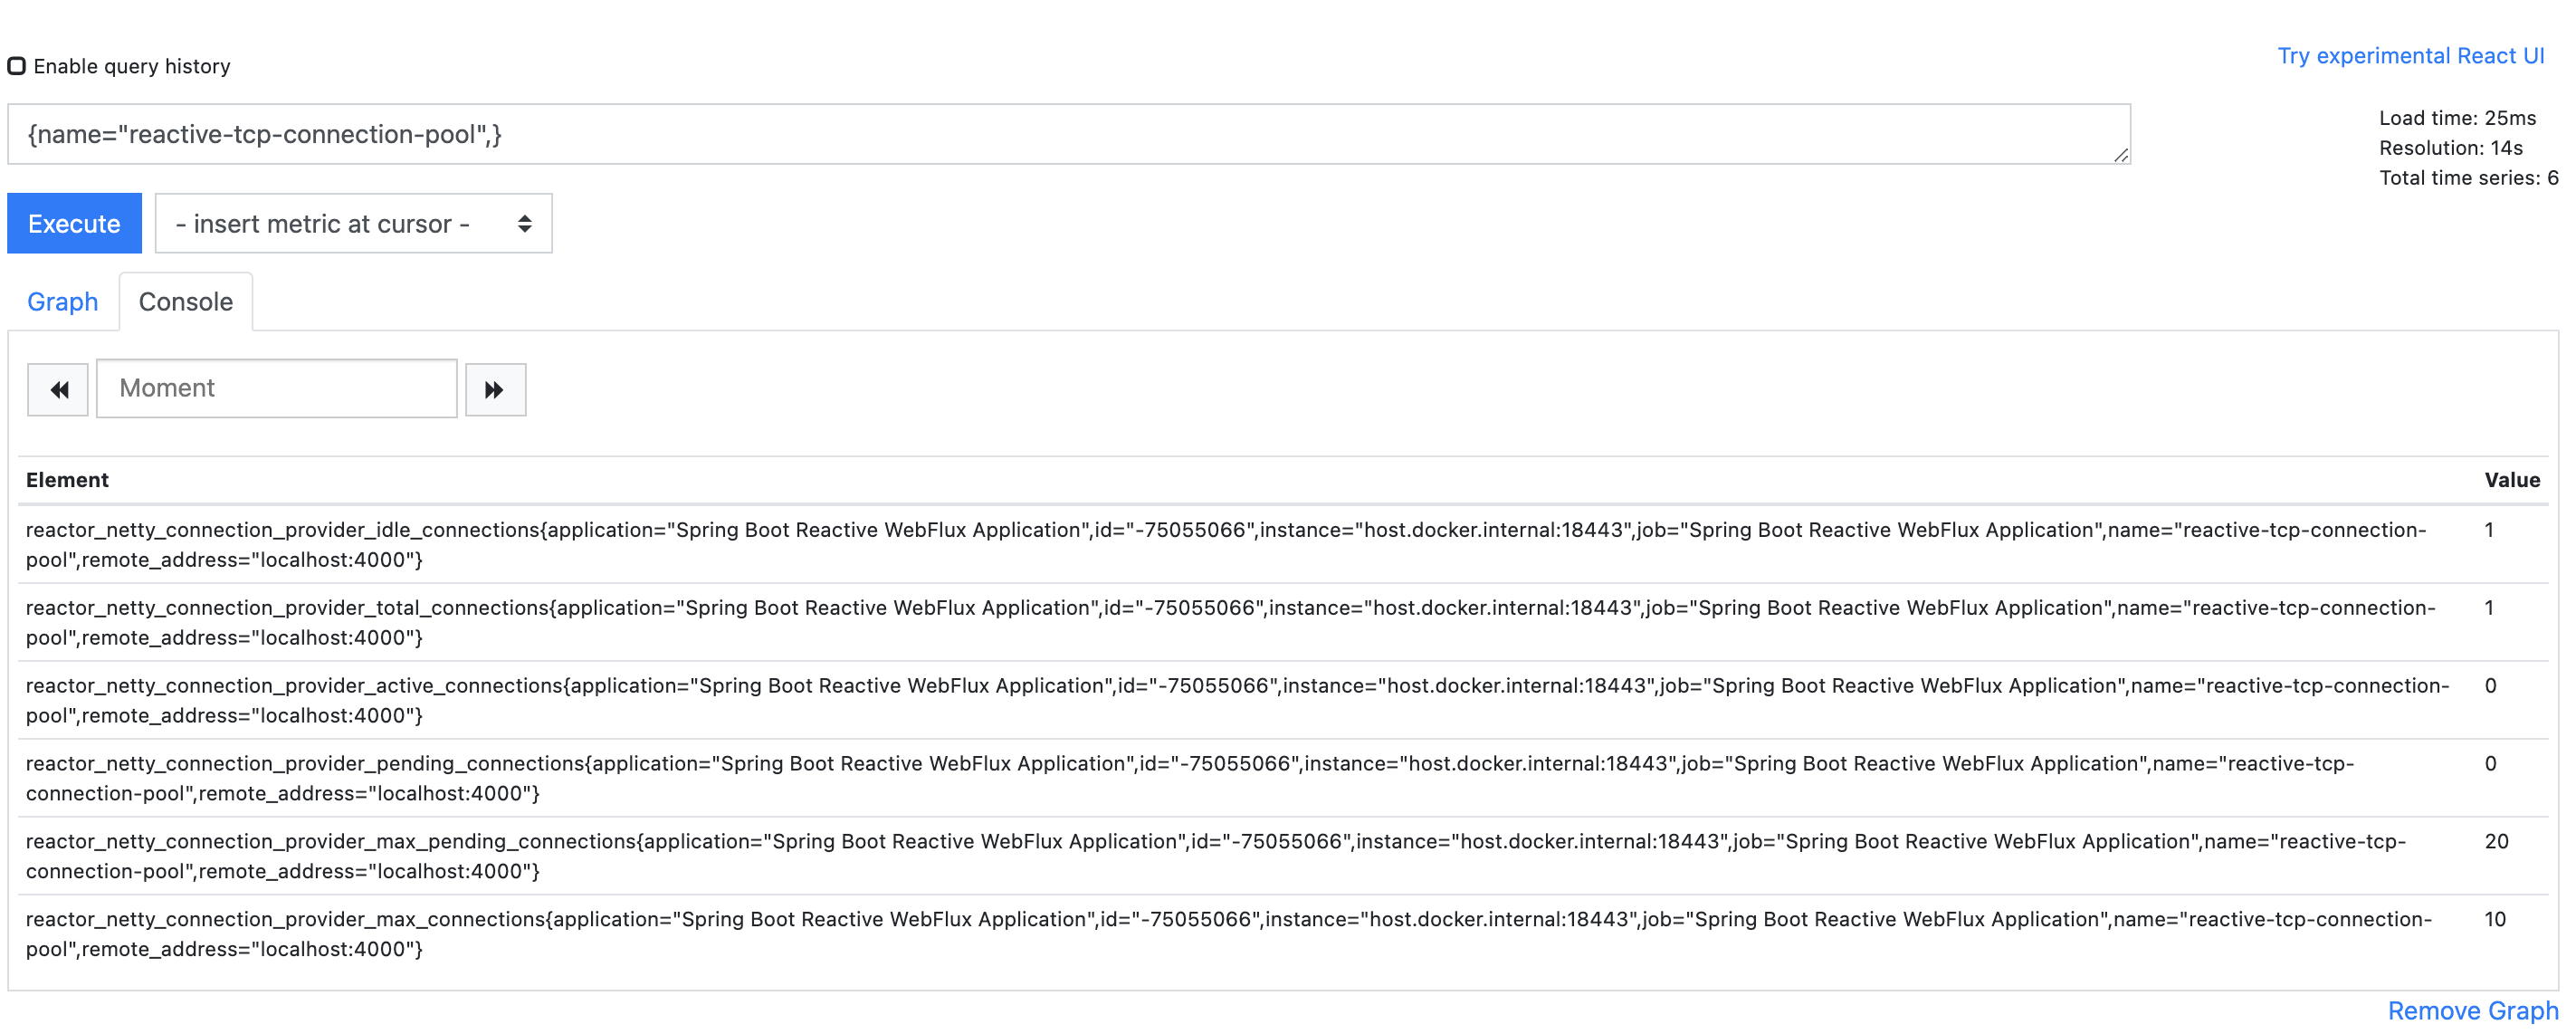
- ตรวจสอบ scrape config client hosts: http://localhost:9090/targets
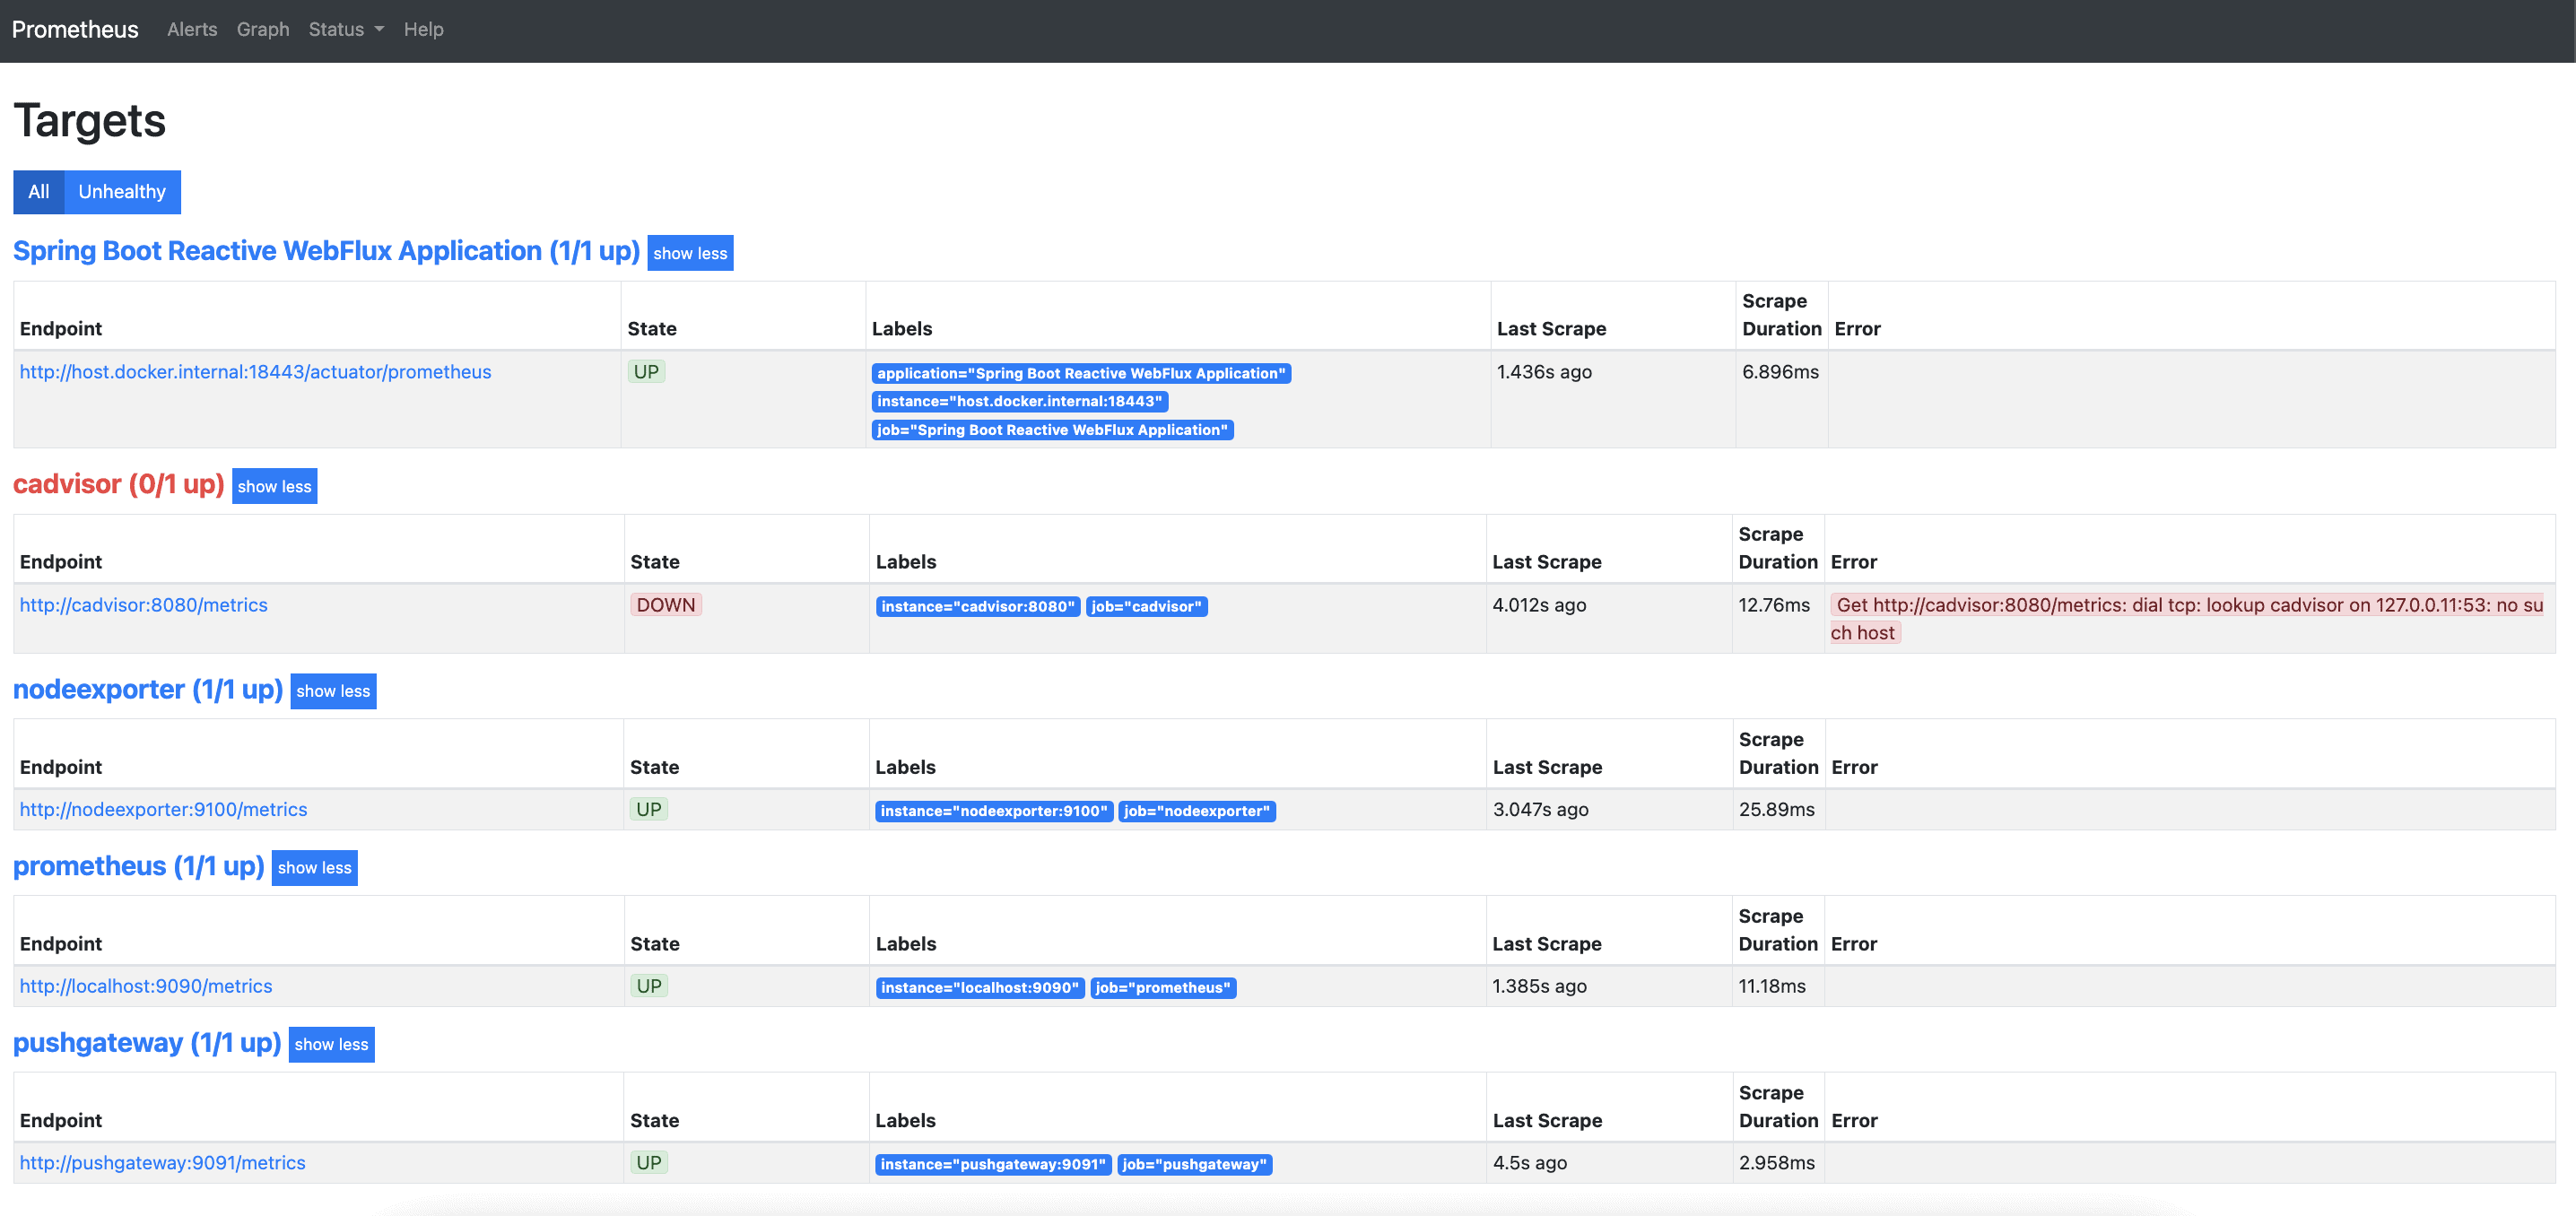
สร้าง Graph monitoring Reactor Netty Connection
- เข้า grafana dashboard : http://localhost:3000/
user: admin
password: admin - กด create Dashboard ใส่ชื่อ “Spring Reactive WebFlux Copy”
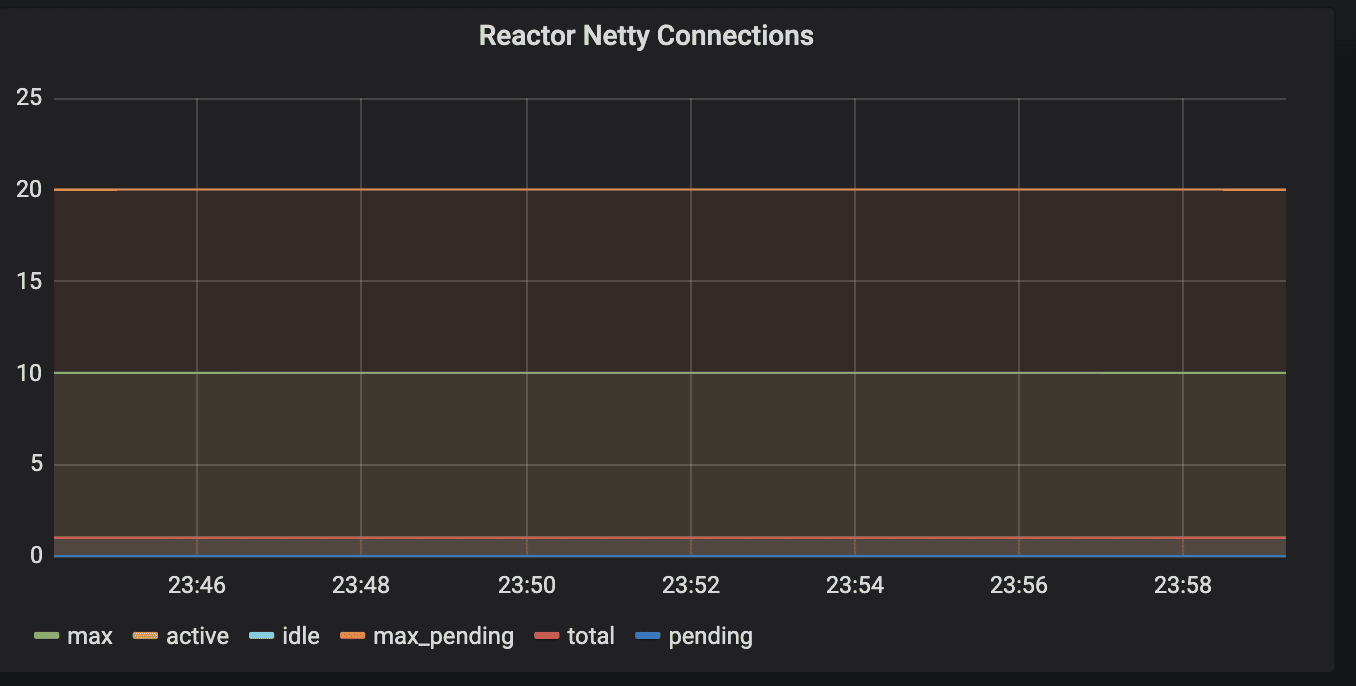
- สร้าง Panel ใหม่ ใส่ชื่อ “Reactor Netty Connections”
- เพิ่ม Graphs Queries
- Graph A: Metrics: reactor_netty_connection_provider_max_connections{name=”reactive-tcp-connection-pool”,}
Legend: max - Graph B: Metrics: reactor_netty_connection_provider_active_connections{name=”reactive-tcp-connection-pool”,}
Legend: active - Graph C: Metrics: reactor_netty_connection_provider_idle_connections{name=”reactive-tcp-connection-pool”,}
Legend: idle - Graph D: Metrics: reactor_netty_connection_provider_max_pending_connections{name=”reactive-tcp-connection-pool”,}
Legend: max_pending - Graph E: Metrics: reactor_netty_connection_provider_total_connections{name=”reactive-tcp-connection-pool”,}
Legend: total - Graph F: Metrics: reactor_netty_connection_provider_pending_connections{name=”reactive-tcp-connection-pool”,}
Legend: pending
- Graph A: Metrics: reactor_netty_connection_provider_max_connections{name=”reactive-tcp-connection-pool”,}
- แก้ไข General tital: “Reactor Netty Connections”
สรุปท้ายบทความ
สำหรับบทความนี้ก็เป็นการ config project เพื่อต่อกับ Prometheus จากนั้นก็ทำข้อมูลไป plot ลอง graph บน Grafana และสำหรับบทความถัด ๆ ไปจะมีเรื่องอะไรมาแชร์ คอยติดตามกันนะครับ